Research Article | | Peer-Reviewed

Evaluation of Common Bean (Phaseolus vulgaris L) Cultivars for Yield and Yield-Related Traits at Sekoru District, South Western Ethiopia

Received: 19 February 2024    Accepted: 13 March 2024    Published: 2 April 2024
Views:       Downloads:
Abstract

The low productivity of common beans is attached to many yield constraints such as lack of improved varieties; poor management practices, biotic and abiotic factors. This study was conducted to evaluate the performance of improved common bean varieties for yield and yield related traits in the Sekoru district of the Jimma zone and identify high-yielding varieties for the study area. Eleven released and one local common bean variety were tested in two locations (Yero Sekoru and Inkure), using a randomized complete block design with three replications. Data were collected for 12 quantitative traits and subjected to analysis using SAS software. The interaction effect of genotype by location showed a highly significant variation for all traits except for plant height, dry biomass yield, and hundred seed weight. The phenotypic coefficient of variation was higher than the genotypic coefficient of variation for all traits. Higher The phenotypic coefficient of variation was recorded for 100 seed weight (52.78), pod length (28.9), pods per plant (27.63), harvest index (25.94) and seed yield (24.6) and also a high genotypic coefficient of variance (GCV) was observed for 100 seed weight (20.24) and pods per plant (20.34). Low (20) and high (93.5) heritability in broad sense were recorded in days to 50% flowering and dry biomass yield, respectively. At the phenotypic level, all traits had a positive phenotypic significant correlation with seed yield per hectare except for primary branches per plant day to 95% physiological maturity and hundred seed weight, while a negative significant correlation with seed yield per hectare was observed for days to 50% flowering. Genotypic path coefficient analysis indicates that the traits studied showed a positive direct effect on seed yield per hectare, while plant height, primary branches and secondary branches per plant, days to 50% flowering, days to 95% physiological maturity and 100 seed weight exhibited a negative direct effect. However, a positive direct phenotypic effect was observed for traits such as dry biomass yield, pod length, primary branches per plant, seeds per pod, and days to 95% physiological maturity. Among the varieties tested in both locations, the highest yield was recorded for the Ser119 variety (2865.2 kg/ha) followed by the Ser125 variety (2699.2 kg/ha). Therefore, recommending these varieties to farmers in the study area is very important to increase production and income.

Published in American Journal of Applied Scientific Research (Volume 10, Issue 1)
DOI 10.11648/j.ajasr.20241001.11
Page(s) 1-16
Creative Commons

This is an Open Access article, distributed under the terms of the Creative Commons Attribution 4.0 International License (http://creativecommons.org/licenses/by/4.0/), which permits unrestricted use, distribution and reproduction in any medium or format, provided the original work is properly cited.

Copyright

Copyright © The Author(s), 2024. Published by Science Publishing Group

Keywords

Common Bean, Heritability, Path Analysis, Genetic Advance

1. Introduction
Increasing the yield of beans is important for millions of people in developing and developed countries around the world. Understanding the production physiology of this crop is one of the most important aspects to achieve this objective. Higher yields are only possible when various physiological processes or yield components are adequately balanced . Yield improvement is an objective of most crop improvement programs. As in other crops, the grain yield of the common bean is a complex characteristic consisting of many morphological and physiological traits . Their genetic resources exist as a complex array of major and minor gene pools, races, and intermediate types, with occasional introgression between wild and domesticated types. Thus, beans are a crop that is adapted to many niches, both in terms of agronomic and consumer preference. While its production is primarily based on small farms, beans are grown in monoculture bush beans to a complex association of indeterminate or climbing beans with maize, sugarcane, and other cereals or fruit crops.
The common bean (Phaseolus vulgaris L) is one of the major legume crops grown in the world due to its high protein fiber and complex carbohydrate content. The common bean is an important grain legume for food and cash from small farmers around the world. However, the total potential benefits to be derived from the common bean as a source of food and income, its complementarities with non-leaf food, and its importance to the environment are underexploited . In 2019, 28 million metric tons of common beans were produced worldwide. In Ethiopia, the area covered by common bean production in 2019/20 was 281,083.49 ha and with total production of approximately 4,855,470.93 Qt.
Common bean research in Ethiopia began in the late 1960s . However, nationally coordinated research in Ethiopia began in the early 1970s by the Melkassa Agricultural Research Center (MARC). At the national level, so far, a large number of common bean germplasm were introduced and evaluated for adaptation and productivity by different institutes (research center and universities). Consequently, more than 68 common bean varieties have been released for some specific traits and for different altitude ranges until 2018. However, only a few genotypes would be suitable for all beans growing environments due to differences in consumer preferences and specificity in adaptation to climatic conditions and cropping systems.
Common bean production faces several constraints that limit its yield. Low soil fertility, diversity of plant pathologies, use of low-performance varieties, climate disturbance, and use of inappropriate farming practices are also the main constraints limiting common bean production among smallholder farmers. Common bean production is constrained by several biotic and abiotic environmental stresses. Biotic factors (field and post-harvest pests and plant diseases) and biotic factors (drought, excessive rain/flooding, poor soil fertility, heat and cold stressors) are known to cause significant reductions in grain yields . Bean anthracnose [Colletotrichum lindemuthianum (Sacc. & Magnus) Briosi & Cavara] poses a major constraint on the production of dry beans in Ethiopia .
The common bean has been produced mainly in the Sekoru district, as all 39 farmers' villages have favorable agroecology and soil type for the production of common beans. Farmers produce common beans by intercropping with maize and most farmers use local varieties. However, the average productivity of common bean in the districts is very low (13qt/ha) compared to the productivity in the research center (19-35 qt/ha). At the national level, so far, a large number of common bean germplasm were introduced and evaluated for adaptation and productivity by different institutes (research center and universities). Consequently, more than 68 common bean varieties have been released for some specific traits and for different altitude ranges until 2018. However, only a few genotypes would be suitable for all beans growing environments due to differences in consumer preferences and specificity in adaptation to climatic conditions and cropping systems. Therefore, the objectives of this study were to evaluate the performance of some common bean cultivars for yield and yield related traits in the Sekoru district, Jimma zone, southwestern Ethiopia, and to identify the cultivar that performs the best for the district.
2. Materials and Methods

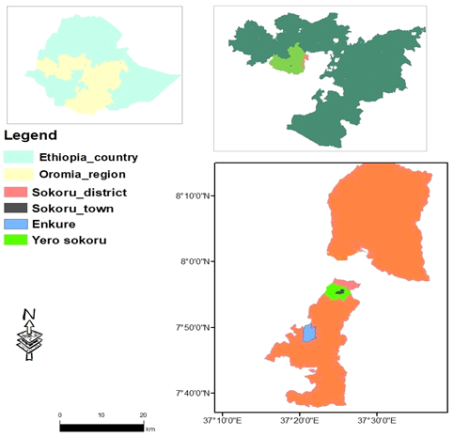
2.1. Description of Experimental Sites

The Sekoru district is located 105 km from the city of Jimma, the total land of the district is 92744 ha from this amount the land used for crop production is 52481 ha, the forest land 3970 ha, the grazing land 8440 ha, the arable land 6003 ha and others 21850 ha. The climate of the district is high land 10%, medium land 60%, and low land 30%. Measure crops grown in the area of Maize, Teff, Sorghum, Wheat, and common bean, the soil type is Nitosol 75% and verity soil 25%. The experiment was carried out in two locations Yero Sekoru and Inkure, located 65 km from each other (Figure 1). Both sites are found in the Sekoru district of two kebeles and represent different locations. The coordinate Yero sekoru (7 to 37) is located at altitude 1787, with an average annual rainfall of 1458 with a minimum and maximum temperatures of 12 and 28.3 respectively. Location Inkurre, (7 50 1 '' to 37 21'45') is located at an altitude of 1520 ma with an average annual rainfall of 1430 with minimum and maximum temperatures of 17.3 and 28.0 respectively. The research was carried out at the nursery site of the Sekoru Agricultural Office for Yerosekoru and For Inkure on the farmers' field.
Figure 1. Map of the study sites.

2.2. Experimental Materials

The research was carried out on a total of twelve varieties of common beans, eleven genotypes of common beans released obtained from Jimma and Melkassa Agricultural Research Center, and one local variety (Table 1). The major selection criteria were based on yield, diseases resistance, and early maturity.
Table 1. Common bean varieties used in the study.

Varieties

Altitude

Color

Yield per hectare

Year of release

Research

Farmers field

SER125

1450-2000

Red

35

22

2014

SER119

1450-2000

Red

33

25

2014

SUG131 (Deme)

1450-2000

Red Speckled

19-24

18-22

2008

Awash2

1450-2000

White

28-31

18-22

2013

ISC-15541Gobe rasha-1

1450-2000

Red

21

18

1998

Nasir

1450-2000

Dark red

30

23-27

2003

SAB736 (Ado)

1450-2000

Large White

20-25

18-22

2014

SAB632 (Tafach)

1450-2000

Speckled

22-26

19-24

2014

Awash01

1450-2000

White

24

20

1990

KATB1 (Ada)

1300-1650

Yellow

19-33

17-25

2013

KATB9 (Dandesu)

1300-1650

Red

22-30

19-23

2013

Local variety (Toma)

1400-2000

Red

-

13

-

2.3. Experimental Design and Trial Management

The experiment was carried out in the Randomized Complete Block Design (RCBD) with three replications. Six rows, each with 30 plants, were used on a 2.4 m by 3 m plot. A distance of 1m was left between the plots and the blocks. Spacings of 40 cm and 10 cm were used between rows and plants, respectively. The land was flat (0-1% slope) and ploughed three times and was very well prepared free of weeds and debris and the layout of the plot was held using the Pythagoras theorem technique. NPSB fertilizer was applied in the form of a base dressing before sowing, at a rate of 100 kg per ha (72 g per plot), while UREA was applied at a rate of 50 kg per ha (36 g per plot) in the form of a top dressing three weeks after sowing or after the first weeding time. Seed sowing was held in the second week of August 2020 in both locations; each variety was sown in each plot randomly; hand weeding was done twice.

2.4. Data Collection

2.4.1. Quantitative Traits Data

Based on the standard evaluation system of the International Board for Plant Genetic Resources , morphological traits are collected from the four middle rows of each plot. The following quantitative morphological and agronomic traits were collected.

2.4.2. Plant Base Data

Plant height: The height of the plants was measured from five randomly taken plants in the maturity stage from the ground level to the tip of the main stem using the four middle rows and averaged with the number of measured plants. Number of pods per plant: The number of pods per plant from five randomly selected plants was counted and averaged. Number of seeds per pod: The number of seeds per pod was counted from the pods harvested from five randomly selected plants. Number of branches per plant: The number of primary and secondary branches from the sample plant from each plot was counted and averaged to the number of sample plants. Pod length: The pod length of five pods from each sample was measured in cm and averaged to five pods.

2.4.3. Plot Base Data

Days to flowering (DF): Days to 50% flowering were recorded as the number of days from sowing to 50% of plants that produced flowers. Days to physiological maturity (DM): Days to 95% physiological maturity: was recorded by counting the number of days from the date of emergence to the date when 95% of the stems, leaves, and pods in a plot change to a light yellow color. Dry biomass yield (kg): The dry biomass yield was determined by taking the total weight of the harvest that included the seeds from each net plot area at physiological maturity. Hundred seed weight (g): The weight of the hundred seeds was determined by taking 100 seeds from randomly taken plants that have grown in the net plot area with a moisture content of 10%. Harvest index: The harvest index was expressed as the ratio of seed yield per total dry biomass of sampled plants multiplied by 100. Grain Yield (GY): The grain yield per hectare was taken by weighing the grain yield in kg obtained from each plot and converting it to kilograms per hectare at 10% moisture content.

2.5. Statistical Data Analysis

Analysis of Variance (ANOVA)
The model for RCBD of individual location is;
Yij= µ + Gi + Bj + ij
Where: Yij= Observed value of genotype i in block j, µ = Grand mean of the experiment,
Gi = Effect of genotype i, Bj= Effect of block j, ij = Error effect of genotype i in block j
The following statistical model was used for the combined analysis of variance over locations:
Yijk = µ + Gi + Ej + GE(ij) + Bk (j) + ijk
Where: Yijk = Observed value of genotype i in block k of the environment (location) j,
µ = Grand mean, Gi = Effect of genotype i, Ej = Effect of environment or location effect, GE(ij) = Effect of interaction of genotype i with environment j, B (j) = Effect of block k in location (environment) j, ijk = Error (residual) effect of genotype i, in block k of environment j
After the data were checked for normality, the data were subjected to Analysis of Variance for individual location using SAS software. Since there was a homogeneous variance of error between the locations, a combined data analysis was employed. When ANOVA showed significant difference, mean separations were performed using the least significant difference (LSD) test at 5% probability level.

2.5.1. Estimation of Phenotypic and Genotypic Variance

The phenotypic and genotypic variance for the analysis of the pooled data in the two locations was calculated using the formula suggested by Hallauer and Mirand as follows.
σ ²p=σ²g+nσ ²gee+σ ²/re
Where, σ 2p = Phenotypic variance
σ 2g = Genotypic variance
σ 2e = environmental variance
σ 2ge=variance of genotype x environment interaction
r=number of replication and e=number of environments
Genotype variance σ2g = (MSg- MSge) rl
Genotype x location interaction variance σ2gl = (MSge – MS error)r
Then by using the methods suggested by Burton and Johnson et al. phenotypic and genotypic coefficient of variation was estimated as a percentage of the corresponding phenotypic (2p) and genotypic (2g) standard deviations of the mean of the trait. Hence,
Where: σ2ph =Phenotypic variation; σ2g= Genotypic variation and x̄= Grand mean of the trait.
Table 2. Outline of analysis of variance for individual location.

Source of variation

DF

SS

MS

F ratio

Replications (r)

r-1

SSr

SS r/r-1

MSg/MSe

Genotypes (g)

g-1

SSg

SSg/g-1

Error

(r-1)(g-1)

SSe

SSe/(g-1)

Total

rt-1

TSS

Table 3. Outline of analysis of variance for combined location.

Source

d.f

SS

MS

F-Value

Environment (E)

e-1

MSE

s2e +gs2r(e) + rg s2e

Replication within E

(r-1)

MSE/ME

s2e +g s2r(e)

MSr/e/Me

Genotypes (g)

g-1

MSr/E

s2e +gs2ge + ers2g

MS3/MSe

GEI

(e-1)(g-1)

MSg

s2e +gs2g

MS4/MSe

Error

e(g-1)(r-1) MSe

MSgei

Total

Erg-1

Note that: DF = degree of freedom, MS = mean squares, r = replication, g = genotypes e= environments, MSE = mean squares due to environments, MSr/E= mean squares due to replication (environments), MSg = mean squares due to genotypes, MSGEI = mean squares due to GEI and MSe = mean squares due to residual

2.5.2. Estimation of Heritability and Genetic Advance

Heritability
The broad-sense heritability values for all parameters (H2) were estimated based on the formula provided by Allard (1999) as follows:
H22g/ σ2pH2=σ²gσ²px100
Where, h² =heritability in broad sense, σ2g = Genotypic variance and, σ2p= Phenotypic variance. Genetic Advance Under Selection (GA)
Genetic advance (GA) and genetic advance as a percentage of the mean (GAM), the predicted response to selection was estimated using the method suggested by Allard and Johnson et al. assuming selection intensity at 5% (2.06). And hence, and GAM=( GA/x) x100.

2.5.3. Phenotypic and Genotypic Correlation Coefficient Analysis

The correlation analysis was performed using SAS software version 9.3. To estimate the phenotypic and genotypic correlation coefficients, the covariance estimates between all pairs of the traits need to be calculated using the formula:
Genotypic covariance (σgxy)=MSPg-MSPer
Phenotypic covariance(σpxy)=σgxy+ σexyr
Where, MSPe =mean sum of the cross product for error, MsPg= mean sum of the cross products for genotypes and r=number of replications. Phenotypic correlation (rp), the observable correlation between two variables, which includes both genotypes and environmental components of the two variables, will be estimated using the formula suggested by Johnson et al. and Singh and Chaudhury
Rpxy = (pcovx.y)/ (√σ2px.σ2py)
Rgxy = (gcovx.y)/ (√σ2gx.σ2gy)
Where: Rpxy and rgxy are phenotypic and genotypic correlation coefficients, respectively; pcovx. and gcovx.y are phenotypic and genotypic covariance between variables x and y, respectively; σ2px and σ2gx are phenotypic and genotypic, variances for variable x; and σ2py and σ2gy are phenotypic and genotypic variances for variable y, respectively.

2.5.4. Path-Coefficient Analysis

The direct and indirect effects of yield-related traits on yield per plot will be worked out through path coefficient analysis. The analysis will be performed following the method suggested by Dewey and Lu . The formula will be described as follows Where: rij = Mutual association between the independent traits (i) and the dependent trait (j), as measured by the correlation coefficient.
Pij = Component of direct effects of the independent trait (i) on the dependent variable (j) as measured by the path coefficient and, Σrikpkj = Summation of the components of the indirect effect of a given independent trait (i) on the given dependent trait (j) via all other independent traits (k).
The residual effect (U) will be calculated using the formula:
U=1-R2
Where R2= ΣPijrij
3. Results and Discussion

3.1. Analysis of Variance

Mean squares from the analysis of variance (ANOVA) of twelve common bean varieties for twelve traits are presented for Yero sekoru, Inkure and combined analysis of the two locations, respectively (Tables 4, 5 and 6). The result of the variance analysis shows that the effect of location and common bean varieties interaction exhibited a significant (p<0.01) difference (p <0.01) for all traits except plant height, dry biomass yield and 100 seed weight (Table 7). The significant effect of the interaction of the location of the characteristics of the variety revealed that the performance of the varieties was influenced by environmental variables in the two locations, resulting in an inconsistency of the performance of common bean varieties in the two locations for such plant traits. This demonstrated the importance of testing varieties in various places and seasons to ensure their stability for use as viable genetic materials for crop improvement and production in a particular region . The result of the variance analysis of variance shows that the genotypes were highly significant for all traits of the combined data. Regarding the present experiment, the existence of genotypic variation in grain yield and yield components has been reported for common bean . Data for number of pods per plant, seeds per pod, branches per plant, plant height, seed yield, and 100 seed weight showed highly significant (p<0.01) differences (p <0.01) between varieties. The current variations in the yield components between varieties are consistent with previous reports . According to the findings, significant variability was observed for plant height, days to 50% flowering, days to 90% physiological maturity, pods per plant, seed yield per pod, hundred seed weight and yield characters . Arya and Ajai reported the highest variances for the yield of the green pods per plant followed by the number of pods per plant, the weight of 100 seeds, and the height of the plant. Similarly, Kamaluddin and Shahid reported significant variation in plant height, number of pods per plant, 100 seed weight and seed yield per plant.
Table 4. Mean squares from the analysis of variance for different sources of variation of 12 common bean varieties tested at theYerosekoru location in 2020/2021.

Traits

Rep df=2

Mean square

Treatment df=11

Error MS DF=22

CV%

Plant height

0.89

5.3**

0.49

0.97

1.72

Primary branches

0.1

0.72**

0.05

0.88

6.41

Secondary branches

0.02

5.1**

0.05

0.98

3.94

Days to flowering

0.36

35.91**

2.85

0.82

4.42

Days to maturity

0.19

19.08**

2.01

0.83

1.58

Pods per plant

0.81

32.16 **

0.74

0.96

7.52

Pod length

0.76

7.89**

0.29

0.93

9.02

Seeds per pod

0.07

3.34**

0.09

0.95

6.02

Dry biomass yield

50550.86

1150024.24**

19976.86

0.97

3.69

Hundred seed weight

0.3

194.2**

1.15

0.99

3.67

Seed yield

2271

947161.18**

40365

0.92

8.41

Harvest index

0.002

0.08 **

0.003

0.93

8.9

where; ** highly significant at 0.01. * Significant at 0.05, cv= coefficient of variation, df = degree of freedom, rep= replication
Table 5. Mean squares from analysis of variance for different sources of variation of 12 common bean varieties tested at the Inkure location in 2020/2021.

Traits

Rep df=2

Mean square

Treatment df=11

Error MS df=22

CV%

Plant height

0.3

2.78NS

1.03

0.73

2.55

Primary branches

0.3

0.63**

0.05

0.88

8.71

Secondary branches

0.4

5.1**

0.05

0.98

4.23

Days to flowering

1.04

2.22NS

1.41

0.62

3.12

Days to maturity

0.38

21.95**

1.47

0.94

1.42

Pods per plant

0.03

5.95*

0.85

0.89

8.61

Pod length

0.06

2.37*

0.49

0.83

13.14

Seeds per pod

0.89

0.71NS

0.33

0.69

12.43

Dry biomass yield

31465.04

797996.95**

18808.7

0.98

3.54

Hundred seed weight

0.004

133.97**

0.8

0.99

3.03

Seed yield

693.38

420323.3**

51228.47

0.89

10.19

Harvest index

0.001

0.03*

0.005

0.86

11.84

where; ** highly significant at 0.01. * Significant at 0.05, cv= coefficient of variation, df = degree of freedom; rep= replication
Table 6. Mean squares from the combined analysis of variance for different sources of variation of 12 common bean varieties tested at both locations in 2020/2021.

Traits

Loc df=1

Mean square

Rep(Loc)df=4

Treatment df=11

Loc x (Trt) df=11

Error df=44

CV%

Plant height

5.14*

3.25

8.09**

0.71NS

0.99

2.43

Primary branches

0.88NS

0.2NS

0.61**

0.44**

0.99

12.13

Secondary bra

3.15NS

0.7NS

6.39**

2.24**

0.41

11.3

Days to flowering

3.56NS

1.69NS

15.44**

22.25**

2.15

3.87

Days to maturity

329.4**

0.5NS

28.84**

22.66**

1.45

1.39

Pod per plant

34.83**

1.02NS

29.95**

9.91**

1.13

9.88

Pod length

2.48 *

1.53*

7.16**

3.84**

0.59

13.44

Seed per pod

5.02**

0.06NS

3.57**

0.67**

0.19

8.91

Dry B/ yield

147.35NS

61523NS

2200276.6**

13560NS

31016.9

4.59

Hundred S/ we

2.84NS

0.41NS

399.84**

0.36NS

0.89

3.19

Seed yield

157922NS

100655NS

1064672.4**

368050.45**

64289.9

10.82

Harvest index

0.01NS

0.01NS

0.09**

0.03**

0.01

12.79

where; ** highly significant at 0.01. * Significant at 0.05, cv= coefficient of variation, df;=degree of freedom, Loc=location, Rep= replication

3.2. Mean Performance of Traits of Common Bean Varieties

Plant Height and branches
The average value for plant height ranged from (38.65cm) to (42.32cm). The tallest mean plant height was recorded for the varieties ser119 (42.32cm), Awash2 (41.55) and KATB1 (41.38cm) while the lowest height is recorded for the varieties Goberasha (38.65cm), Dame (39.55cm) and local (38.7cm) (Table 7). The height of the plant was also reported to vary considerably between bean varieties from 33 to 70 cm and 35.63 to 53.04 cm . According to Su et al. short plant height attributes to drought tolerance capacity that will lower the transpiration rate and ultimately reduce moisture stress during drought. But, in nonmoisture-stressed environments, tall plant height is important to produce better numbers of branches and more pods per plant. In terms of the present study, the varieties with high plant height produced more branches per plant and a large number of pods per plant, which contributes to a better amount of seed per plant. This result is supported by Al-Ballat and Al-Araby who reported that the height of the plant is positively and significantly correlated with the number of pods per plant and the seed yield per plant. The number of pods / plant showed significant differences between treatments. The average value for the primary and secondary branch ranged from (2.28cm) to (3.09cm) and (2.75cm) to (6.39 cm), respectively. The longest mean primary branch length was recorded for the variety Ser 119 (3.09cm) and the lowest length was recorded for the varieties Awash o1 (2.28cm), and Goberasha (2.28cm) and the local variety (2.07) In terms of the secondary branch, the longest secondary branch was measured for the varieties Ser119 (6.95cm), Ser125 (6.39cm) and Awash 2 (6.34cm) while the lowest was measured for the local variety (2.75cm) (Table 7) As the number of branches increases, it may have both positive and negative impacts on the crop productivity.
As leaves compete for light and the resources required to produce biomass, a large number of branches can result in a poor photosynthetic rate, reduced leaf area, and short stem length of the branches. On the contrary, the research findings on pigeon pea carried out by Ram et al. . Furthermore, Kandarkar et al. also presented that the number of branches per plant showed the highest direct positive effect on grain yield, indicating that genotypes with a better number of branches will result in more yield. The present study partially supports the above findings in that the varieties with more branches (Ser 125 and Ser 119) produced a better amount of grain yield.
Table 7. Mean of different traits of Common bean varieties tested at two locations in Sekoru district in Jimma zone in 2020/2021.

Varieties

PH (cm)

PB (cm)

SBPP (cm)

DF

DTM

PPP

PL

SPP

DBY (kg/ha)

HSW

SY (kg/ha)

HI

SER125

41.14b

2.88cd

6.39ab

37.5fed

87.83c

11.99b

6.76b

5.41b

4091.0 c

19.73g

2699.2ba

0.67bc

SER119

42.32 a

3.09a

6.95a

38.17bed

87.66c

15.45a

7.67a

6.08a

5218.33 a

24.63d

2865.2a

0.55ed

Deme

39.55de

2.5e

5.61de

39.5 bac

92.17a

10.63cd

5.36d

4.7c

4524.00b

36.08b

2308.0dc

0.51e

Awash2

41.25ba

2.5e

6.24ac

38.fedc

84.17d

11.37cb

6.32cb

5.63ba

3625.5 d

20.87fe

2581.8bac

0.72ba

Gobe rash

38.65e

2.29e

4.99df

38fedc

87.7c

9.49d

5.07d

4.35c

3486.8edf

38.31a

2011.7e

0.57ed

Nasir

41.01b

2.5e

5.99cd

36.33fg

86.5c

11.18cb

6.28cb

5.21b

3594.8ed

24.43d

2537.7bdc

0.71ba

SAB736

39.5de

2.52de

5.66cde

38.37bdc

87.83c

10.42cd

5.51cd

4.35c

3056.8g

36.47b

2346.2dc

0.77a

SAB632

41.05b

2.99b

6cd

36.83feg

87.87c

10.83cb

5.8cd

4.56c

3293 f

38.47a

2420.5bdc

0.74ba

Awash01

39.79dc

2.28eg

5.66cde

39.83ba

87c

10.39cd

5.11d

4.54c

4176.3 c

19.83fg

2278.0ed

0.55ed

KATB1

41.38ba

2.96c

5.85cd

36.33fg

87.5c

11.31cb

5.94cb

5.29b

4045.3c

34.92c

2433.7bdc

0.62dc

KATB9

40.9bc

2.53de

5.72cde

35.16g

87.67c

10.85cb

5.93cbd

5.24b

3503.7ed

38.21a

2439.5bdc

0.70ba

Loc /var

38.7de

2.7d

2.75g

40.67a

90.17a

5.4e

3.19e

3.14d

3402.17ef

21.43f

1194.7f

0.35f

LSD

1.16

0.37

0.74

1.71

1.40

1.24

0.89

0.51

204.92

4.24

295.03

0.09

CV

2.46

12.12

11.3

3.87

1.38

9.88

13.26

8.91

4.59

11.94

10.82

12.79

PH: Plant height; PB: primary branch; SBPP: secondary branch per plant; DF: days to50% flowering; DTM: days to 80% physiological maturity; PPP: pods per plant; PL: pod length; SPP: seeds per pod; DBY: dry biomass yield; HSW: hundred seed weight; SY: seed yield; HI: harvest index; CV: coefficient of variation; LSD: Least significant difference; Means with same factor and column followed by the same letter are not significantly different at a level of significance of 5%
Days to flowering and Days to physiological maturity
The mean value of days to 50% flowering and 80% physiological maturity ranged from (35.16 days) to (40.67) and (84.17 days) to (92.17 days), respectively. The result of the analysis of variance shows that the varieties for days for 50% flowering exhibited highly significant variations (p<0.01) results of previous research have also shown significant differences for days to flowering . The varieties that took fewer mean days to 50% flower were KATB9 (35.16), KAT B1 (36.33), Nasir (36.33) and SAB632 (36.83) while those that took a long day were Local variety (40.67), Awash 01 (39.83), Deme (39.5) (Table 7). The highest and medium seed-producing varieties (Ser125, Awash 2, Nasir, SAB 632KAT B1 and KAT B9) had a statistically similar number of days to flower. Under rain-fed conditions, reported a shorter period from sowing to first flowering for adapted cultivars of common bean. Thus, the present finding matched this report and this phonological plasticity has contributed to the high seed yield performance of these varieties. The mean short day (84.17day) to 80% maturity period was recorded for the variety Awash2 and the longest day 80% maturity period (92.17day) and (90.17) was recorded for the variety SUG131 (Deme) and the local variety, respectively, these are also the least yielding varieties (Table 7). Therefore, as they are the latest maturing varieties for the study areas and are good for production in areas where rain falls for at least three months.
Number of pods per plant, Pod length, and seed per pod
The mean value of pods per plant ranged from (5.40) to (15.45). The highest pod number (15.45) was recorded for the variety (Ser119) and the lowest pod number (5.40) was recorded for the local variety. Prakash and Ram, reported the variation in the number of pods per plant which ranged from 10.46 to 30.22 in the French bean. The result reveals that the mean value of the pod length ranged from (3.19cm) to (7.67cm). The Ser119 variety has a longer pod length (7.67 cm), while the Local (Toma) variety has the shortest pod length (3.19cm), and also the average value of seed per pod ranged from (3.14) to (6.08). The highest number of seeds per pod was recorded for the Ser119 (6.08) and Awash2 (5.63) variety, while the lowest average number of seeds per pod (3.14) was recorded for the local variety (Table 7). In line with these findings, several authors reported significant variation between common bean varieties for days to maturity, plant height, number of seeds per pod, number of pods per plant, hundred seed weight, grain yield .
100 seed weight
The average value of hundred seed weight ranged from (19.83) to (38.47). The highest average hundred seed weights were recorded for the varieties SAB632 (38.47), Goberasha (38.31) and KAT B1 (38.21), while the lowest was recorded for the varieties Awash 01 (19.83), Awash2 (20.87) and local variety (21.43). The weight of the hundred seed is also one of the most important yield components that reflect the magnitude of seed development that ultimately reflects the final yield of the crop (Table 7).
Seed yield
The mean value of the seed yield ranged from (1194.7kg/ha) to (2865.2 kg / ha); interestingly, the maximum average seed yield /ha was obtained from the variety Ser119 (2865.2kg/ha) and Ser 125 (2699.2) while the lowest average seed yield/ha (1194.7kg/ha) was recorded for the local variety (Table 7). Today, the development of the superior varieties in terms of yield and other many different traits is very critical to address the required challenges of human population growth and climate change. Overcoming these difficult challenges will be harder in the absence of plant genetic improvement to increase agricultural productivity through addressing the problem of yield reduction and its links with pest management and climate change. Most varieties performed above the overall mean, except Goberasha and the local variety. Reported seed yield performance of the common bean genotypes studied in the range of 1300 to 3500 kg /ha. The rankings of the varieties were different for the seed yield performance in the locations. The highest-yielding variety, Ser119 and Ser125 showed higher seed yield performance in two of the test locations. Yerosekoru Ser119 (2870.7 kg/ha), Ser 125 (2696.7 kg / ha) and Inkure Ser119 (2859.7kg/ha), Ser125 (2701.7kg/ha). This result is consistent with the findings stated by Daniel et al. who discovered significant differences in grain production between common bean varieties. Similarly, Gebre-Egziabher et al. and Dembele and Ashenafi found similar results on the same crop and found significant variation between varieties.

3.3. Variance Components

Genotypic and phenotypic coefficients of variation
The present study indicated that the phenotypic variance and the phenotypic coefficient of variance were higher than their corresponding genotypic variance and the genotypic coefficient of variance respectively for the traits studied (Table 8). This indicated that the influence of the environment on the expression of these traits was high. The phenotypic coefficient of variance (PCV) ranged from 3.72% for plant height to 40.46% for primary branches per plant, while the genotypic coefficient of variance (GCV) ranged from 2.69% for plant height to 27.69% for hundred seed weight (Table 8).
According to Subramanian and Menon phenotypic coefficient of variance (PCV) and genotypic coefficient of variance (GCV) values greater than 20% less than 10% and between 10% and 20% are regarded as high, low, and medium, respectively. Based on this, a high phenotypic coefficient of variance (PCV) was observed for the primary branches per plant (40.46) pod length (28.9), 100 seed weight (27.91), pods per plant (27.63), harvest index (25.94), secondary branch per plant (25.14) and seed yield (24.6), and also a high genotypic coefficient of variance (GCV) was observed for 100 seed weight (27.69), pods per plant (20.34) and primary branches per plant (20.25). Moderate PCV was observed for primary branches per plant, seeds per pod, and dry biomass yield. Moderate GCV was observed for primary branches per plant, pod length, seeds per pod, dry biomass yield, seed yield, and harvest index, while low PCV and GCV were observed for day to flowering, day to maturity, plant height, and secondary branch per plant (Table 8). This reflected the pronounced influence of environmental factors on the expression of these characters. In all variance analysis, the phenotypic coefficient of variation was higher than the genotypic coefficient of variation. However, the relatively larger magnitude of difference between the two was observed in seed yield ha-1, primary branch per plant, secondary branch per plant, harvest index and pod length. This indicates the greater influence of environmental factors than genetic factors on the expression of these traits. In these traits, selection based on phenotype performance may not be appropriate. Wani et al. suggested that a larger difference between GCV and PCV is due to a larger influence of the environment on that trait. In common beans, Wani et al. reported a wide range of GCV and PCV values were reported by Wani et al. ; Ahmed and Kamaluddin .
Heritability and Genetic Advance
The general sense heritability ranged from 20% to 93.5% for the traits studied (Table 8). According to Jonson et al. heritability values more than 60% considered high, whereas values less than 30% considered low and values between 30%and 60% are moderate. Based on this, high heritability was recorded for dry biomass yield (93.5), hundred seed weight (88.4) and seed per pod (61.7) indicating that the environment has little influence on the expression of the characters, suggesting direct selection using these characters as major contributors to yield components to improve yield of common bean genotypes. This high heritability may be due to additive gene effects; hence these traits are likely to respond to direct selection in order to improve common bean grain yield through direct selection for grain yield related traits. Similarly, Wondwosen and Abebe obtained a high heritability (>60%) for the grain yield traits, hundred grain weight, days to maturity, days to flowering, number of seeds per pod, number of pods per plant to support our result. Similarly, Raffi and Nath also reported high heritability (>60%) for days to flowering, days to maturity, yield, seed weight, pod length, plant height, which supports our findings. Esho, reported high heritability for plant height, pod length, number of seeds per pod, hundred seed weight and seed yield. Alghamdi, observed that the highest heritability estimates were recorded for the number of pods and the number of seeds per plant. Moderate heritability was observed for plant height, pods per plant, harvest index, seed yield, pod length, secondary branches per plant, and days to 80% physiological maturity, which may occur due to influence of the environment on the polygenic nature of these traits. Low heritability was estimated for days to 50 % flowering and primary branches per plant, which limits the possibility of including the traits to select desirable genotypes. This may be due to the higher influence of the environment on the expression of phenotypic variation than genotypic variation.
The genetic advance as a percent mean ranged from 2.97% for day to 80% physiological maturity to 56.59% for 100 seed weight (Table 8). This result indicated that selecting the top 5% of the genotypes could result in an advance of 2.97-56.59% over the mean of the respective population. As suggested by Sivasubramanian and Madhavamenon the genetic advance as a percentage of the mean was classified as low (<10%), moderate (10–20%) and high (>20%). Based on this result, a high genetic advance as percentage of the mean was observed for 100 seed weight, dry biomass yield, pods per plant, harvest index, seed yield, seeds per pod, pod length, primary branches and secondary branches per plant. A low percentage of genetic advance was also estimated for day to 50% flowering day to 80% physiological maturity and plant height. If the value of genetic advance is high, the character is governed by additive genes, and selection will be beneficial for such traits. If genetic advance is low, the character is governed by nonadditive genes and heterosis breeding may be useful.
For the success of estimation of selection accompanying heritability with genetic advance, is useful. High heritability was observed along with high genetic advance for hundred seed weight, seeds per pod, and dry biomass yield. The traits that showed moderate heritability with a high genetic advance were secondary branches per plant, pods per plant, pod length, and seed yield. Hence, these traits should be given top priority during selection in common bean breeding because they are the main portion of genetic variation attributable to additive gene action, and selection may be effective in early generations for these traits. Low genetic advance along with low heritability was observed for days to 50% flowering, days to 80% physiological maturity, and plant height. This indicates that these traits were highly influenced by the environment and the direct selection of the traits is not promising.
Table 8. Heritability, genetic advance, and coefficient of variation.

Traits

Mean range

σ 2 g

σ 2P

PCV %

GCV %

H2 %

GA

GAM %

PH

38.65-42.32

1.18

2.27

3.72

2.69

52

3.99

9.86

PB

2.28-3.09

0.28

1.08

40.46

20.25

25

0.55

21.03

SBPP

2.75-6.95

0.99

2.01

25.14

8.37

50

1.45

25.68

DTF

35.17-40.67

2.22

11.06

8.77

3.93

20

1.37

3.62

DTM

84.17-92.17

4.56

13.09

4.13

2.44

34.9

2.6

2.97

PPP

5.40-15.45

4.8

8.86

27.63

20.34

54.2

3.32

30.85

PL

3.19-7.89

1.09

2.77

28.9

18.15

39.4

1.32

23.48

SPP

3.46-6.08

0.56

0.91

19.6

15.39

61.7

1.21

24.91

DBY

3056-5218.3

361543,3

386741.2

16.22

15.68

93.5

1197.6

31.23

HSW

19.73-38.47

66.49

67.56

27.91

27.69

88.4

16.67

56.59

SY

1194.7-2865.2

166730

332273.9

24.6

17.42

50.18

595.85

25.43

HI

0.35-0.88

0.01

0.03

25.94

18.7

51.9

0.17

27.76

Where 2 G =genotypic variance, 2 p =phenotypic variance, GCV= genotypic coefficient of variation, PCV=phenotypic, coefficient of variation, H2=heritability in broad sense, GA=genetic advance, GAM=genetic advance as percent of mean PH=plant height PB=primary branches per plant, SBPP=secondary branches per plant, DTF= days to flowering, DTM=days to maturity, PPP= pods per plant, PL=pod length, SPP=seeds per pod, DBY=dry biomass yield, HSW = hundreds of seed weight, SY=seed yield, HI= harvest index.

3.4. Association of Traits

3.4.1. Phenotypic Association

The phenotypic correlation coefficients among the yield-related traits are presented in Table 9, The seed yield per hectare has a significant and positive phenotypic correlation with plant height, secondary branches per plant, pods per plant, pod length, seeds per pod, and dry biomass yield. This indicates that the correlation of these traits with seed yield could be utilized fruitfully to improve the potential of haricot bean yield. Gonçalves et al. stated that the traits which have moderate to strong correlations with the desired traits are important for successful indirect selection in the initial stages of plant breeding. This result is consistent with the findings of many researchers who found positive correlations between seed yield and plant height In this study a non-significant association of seed yield per hectare with primary branches per plant and a negative significant correlation with days to physiological maturity of 80% and also a negative non-significant correlation of seed yield with days to maturity at the phenotypic level was observed.
In several traits, environmental correlations presented differences in value and sign, in relation to phenotypic and genotypic correlations, indicating that different physiological processes affect the genetic and environmental variations of these traits, and the environment may restrict direct selection . Gonçalves et al. Plant height was significantly and positively associated with secondary branches per plant, pods per plant, pod length, seeds per pod, dry biomass yield, and seed yield. A positive nonsignificant association was observed for primary branches per plant with plant height, secondary branches per plant, days to 80% physiological maturity, pods per plant, pod length, seeds per pod, dry bio mass yield, and seed yield.

3.4.2. Genotypic Correlation

Genotypic correlation coefficients among yield-related traits are presented in Table 10. The seed yield showed a positive and significant genotypic association with plant height, secondary branches per plant, pods per plant, pod length and seeds per pod. Plant breeders can use genetic correlations because they are heritable. As suggested by Lopes et al. , indirect selection of traits can be performed when their correlation coefficient values with the desired trait are higher than 0.50. Consequently, in the present study, the correlation coefficient is considered weak when it is less than 0.50, moderate when it varies from ± 0.50 to ± 0.69 and strong when it varies from ± 0.70 to ± 0.89 and very strong when it is greater than ± 0.90. The height of the plant showed a positive and significant association with secondary branches per plant, pods per plant, pod length, seeds per pod, and seed yield. A negative and significant association was found for days to 50% flowering with plant height, pod length, seeds per pod, and seed yield. Plant length and number of pods/plant have been observed to be correlated with seed yield/plant. These outcomes find the true association with seed weight and are considered as seed mass/plant predictors, according to which we can select plants with more height directly and with more number of pods/plant that can perform better and enhance seed yield/plant. Gonçalves et al. also observed that these desired traits with a strong correlation are crucial for selection in plant breeding. In agreement with this result, Alghamdi and Ballat and Araby reported a positive and significant association of seed yield with plant height, pods/plant, and branches/plant and with other characters.
Table 9. Phenotypic (above diagonal) Genotypic (below diagonal) correlation coefficient for agronomic traits of Haricot bean varieties tested in Y / Sekoru and Inkure.

PH

PB

SBPP

DTF

DTM

PPP

PL

SPP

DBY

HSW

SY

PH

0.16ns

0.47**

-0.30**

-0.09ns

0.56**

0.55**

0.64**

0.29*

-0.15ns

0.56**

PB

0.20ns

0.17ns

-0.01ns

0.08ns

0.23ns

0.14ns

0.03ns

0.16ns

0.28*

0.22ns

SBPP

0.61*

0.18ns

-0.24*

-0.16ns

0.50**

0.51**

0.46**

0.25*

-0.06ns

0.48**

DTF

-0.81**

0.08ns

-0.39ns

-0.06ns

-0.29*

-0.47**

-0.42**

0.08ns

-0.21ns

-0.45*

DTM

-0.19ns

-0.05ns

-0.29ns

0.65*

-0.19ns

-0.15ns

-0.17ns

0.20ns

-0.06ns

-0.12ns

PPP

0.91**

0.41ns

0.76**

-0.54ns

-0.23ns

0.87**

0.85**

0.49**

-0.03ns

0.87**

PL

1.00**

0.25ns

0.84**

-0.67*

-0.36ns

1.01**

0.84**

0.32**

-0.06ns

0.69**

SPP

0.96**

0.06ns

0.66*

-0.70*

-0.37ns

0.95**

1.00**

0.41**

-0.12ns

0.56**

DBY

0.50ns

0.18ns

0.27ns

0.21ns

0.35ns

0.68*

0.56ns

0.58ns

-0.30*

0.31**

HSW

-0.19ns

0.29ns

-0.05ns

-0.52ns

0.09ns

-0.03ns

-0.07ns

-0.13ns

-0.31ns

-0.01ns

SY

0.91**

0.30ns

-0.71*

-0.65*

-0.35ns

0.97**

0.98**

0.95**

0.48ns

-0.01ns

When, PH= plant height, PB=primary branch, SBPP=secondary branch per plant, DTF=days to 50% flowering, DTM=days to maturity, PPP=pods per plant, PL=pod length, SPP=seeds per pod, DBY = dry biomass yield, HSW = hundreds of seed weight, SY=seed yield

3.4.3. Analysis of the Phenotypic Path Coefficients

The analysis of the phenotypic path coefficient showed that dry biomass production (0.839) had a high positive direct effect on seed production per hectare followed by pod length (0.098) and seeds per pod (0.028) (Table 10). The indirect effects of a large number of other characters through this trait were also positive. These traits also showed a positive and significant phenotypic correlation with seed yield per hectare. Many researchers found a positive direct effect on seed production for plant height ; number of days to maturity ; number of pods per plant ; number of seeds per pod and 100 or 1000 seed weight . In contrast, negative direct effects on seed yield have been reported for plant height ; number of leaves per plant and number of days to flowering ; number of days to maturity ; number of pods per plant and number of seeds per pod ; pod length and 100 or 1000 seed weight . In this study, a negative direct effect on seed yield per hectare was observed for plant height (-0.007), hundred seed weight (-0.029), days to 50% flowering (-0.039), secondary branches per plant (-0.046) and pods per plant (-0.059) and similarly indirect effects of other different characters through these traits were negative. The negative direct effect of these characters on seed yield per hectare indicates that direct selection of these traits may be ineffective in improving seed yield per hectare. The positive correlation observed between these traits and seed yield at the phenotypic level is explained by the positive indirect effect they produce through pod length and dry bio mass yield.
Table 10. Phenotypic path coefficient of traits of common bean varieties evaluated in Yerosekoru and Inkure, Sekoru district of Jimma zone in the 2020/2021 cropping season.

PH

PB

SBPP

DTF

DTM

PPP

PL

SPP

DBY

HSW

rp

PH

-0.007

0.007

-0.019

0.005

0.006

-0.029

0.048

0.015

0.462

-0.001

0.56**

PB

-0.002

0.027

-0.012

0.009

0.007

-0.029

0.047

0.009

0.353

-0.002

0.22ns

SBPP

-0.003

0.007

-0.046

0.009

0.005

0.028

0.05

0.013

0.353

-0.002

0.48**

DTF

0.001

-0.006

0.011

-0.039

-0.002

0.017

-0.046

-0.12

-0.201

0.012

-0.45*

DTM

-0.002

0.009

-0.011

0.003

0.021

-0.015

0.024

0.004

0.229

-0.008

-0.12ns

PPP

-0.004

0.013

-0.023

0.012

0.001

-0.059

0.085

0.02

4.605

-0.008

0.87**

PL

-0.004

0.013

-0.024

0.019

0.005

-0.051

0.098

0.02

4.571

-0.011

0.69**

SPP

-0.004

0.009

-0.021

0.017

0.003

-0.049

0.083

0.028

0.568

-0.007

0.56**

DBY

-0.004

0.016

-0.019

0.009

0.006

-0.042

0.067

0.019

0.839

-0.007

0.31**

HSW

-0.001

0.012

-0.003

0.016

0.005

-0.016

0.035

0.007

0.19

-0.029

-0.01ns

R=0.0112
When, PH= plant height, PB=primary branch, SBPP=secondary branch per plant, DTF=days to 50% flowering, DTM=days to maturity, PPP=pods per plant, PL=pod length, SPP=seeds per pod, DBY = dry biomass yield, HSW = hundreds of seed weight

3.4.4. Genotypic Path Coefficient Analysis

In this study, the genotypic path coefficient analysis showed that dry biomass yield (0.646) showed the highest genotypic direct effect on seed yield per hectare followed by pod length (0.119) and pods per plant (0.077) (Table 11). In addition to dry biomass yield, other traits also showed a positive and significant genotypic correlation with seed yield per hectare. The direct positive direct effect of these traits implies that direct selection of these traits can be effective in improving seed yield per hectare of haricot bean. The indirect effects of other characters through these traits were also positive for a large number of traits. The genotypic direct effect of days to 50% flowering (-0.001), primary branches per plant (-0.005), days to 80% physiological maturity (-0.024), secondary branches per plant (-0.031), hundred seed weight (-0.038) and plant height (-0.045) on seed yield per hectare was negative. This indicates that using this trait as selection criteria in improving seed yield per hectare may not be effective. Direct negative effects on seed yield have been reported for plant height; number of leaves per plant ; number of days until flowering . In general if correlation between dependent and independent characters is due to the direct effect of a character, it reflects a true relationship between them. Therefore, selection can be done to improve the dependent character. The residual effect shows how much the explanatory variables represent the variability of the dependent variable . The residual effect in our study on the genotypic path coefficient was 0.0041, indicating that the traits studied explain 99 % of the variability in seed yield .
Table 11. Genotypic path coefficient analysis of haricot bean varieties tested in YeroSekoru and Inkure Sekoru district of the Jimma zone in 2020.

PH

PB

SBPP

DTF

DTM

PPP

PL

SPP

DBY

HSW

rg

PH

-0.045

-0.001

-0.019

0.001

0.005

0.07

0.119

0.064

0.319

0.007

0.91**

PB

-0.009

-0.005

-0.006

-0.001

0.001

0.032

0.03

0.004

0.114

-0.011

0.30ns

SBPP

-0.028

-0.001

-0.031

0.001

0.007

0.058

0.101

0.044

0.177

0.002

-0.71*

DTF

0.038

-0.001

0.012

-0.001

-0.015

-0.042

-0.079

-0.047

0.136

0.019

-0.65*

DTM

0.009

0.001

0.009

-0.001

-0.024

-0.017

-0.042

-0.025

0.224

-0.003

-0.35ns

PPP

-0.042

-0.002

-0.023

0.001

0.005

0.077

0.12

0.063

0.436

0.001

0.97**

PL

-0.046

-0.001

-0.026

0.001

0.008

0.078

0.119

0.067

0.362

0.003

0.98**

SPP

-0.045

-0.001

-0.02

0.001

0.009

0.073

0.119

0.067

0.376

0.005

0.95**

DBY

-0.023

-0.001

-0.008

-0.001

-0.008

0.052

0.067

0.039

0.646

0.012

0.48ns

HSW

0.009

-0.001

0.002

0.001

-0.002

-0.002

-0.008

-0.009

-0.198

-0.038

-0.01ns

R=-0.0041
When, PH= plant height, PB=primary branch, SBPP=secondary branch per plant, DTF=days to 50% flowering, DTM=days to maturity, PPP=pods per plant, PL=pod length, SPP=seeds per pod, DBY = dry biomass yield, HSW = hundreds of seed weight
4. Conclusion and Recommendation
The purpose of this study was to evaluate the yield and related traits of the released and one local common bean variety in two locations in the Sekoru district of the Jimma zone, in the south western of Ethiopia, with the objective of identifying the best performing varieties for the study area. To accomplish the evaluation process, twelve common bean varieties were selected and tested using a randomized complete block design with three replications under rain-fed conditions in Sekoru agro ecology of two locations, namely Yerosekoru and Inkure. The results showed that the genotypes were highly significant for all traits in both locations. This indicates the presence of valuable variation among genotypes that help for breeding purposes. Highly significant G x L interactions were observed for combined data of all traits except for plant height, dry biomass yield, and hundred seed weight. This indicates that the genotypes responded differently for the traits in the two locations. The phenotypic coefficient of variation was higher than the genotypic coefficient of variation, indicating that the influence of the environment is higher than the genotypic influence on the expression of these traits. The results of this research showed that a high phenotypic coefficient of variation was observed for traits such as hundred seed weight, dry biomass yield, pod length, pods per plant, harvest index and seed yield, and a high genotypic coefficient of variation was observed for the traits hundred seed weight and pods per plant. In this study, high heritability with high genetic advance was observed for the traits hundred seed weight, seeds per pod, primary branches per plant. The correlation coefficient was used to generate information on the association of characteristics and observed a positive phenotypic significant correlation with seed yield per hectare for all traits except primary branches per plant, days to 80% physiological maturity and days to 50% flowering, which showed a negative significant and nonsignificant correlation with seed yield per hectare at the phenotypic level. Genotypic path coefficient analysis indicates that the traits studied that showed a positive direct effect on seed yield per hectare were dry biomass yield, pod length, seeds per pod and pods per plant and also those traits that showed a negative direct effect on seed yield per hectare were plant height, primary branches and secondary branches per plant, days to 50% flowering, days to 80% physiological maturity, and 100 seed weight. Among the varieties studied, Ser119 and Ser125 showed a higher seed yield performance in two of the test locations, Yerosekoru Ser119 (2870.7 kg/ha), Ser 125 (2696.7/ha) and Inkure Ser119 (2859.7kg/ha), Ser125 (2701.7kg/ha) and also their average yield performance in the area was Ser119 (2865.2 kg/ha) followed by Ser125 (2699.2 kg/ha) and also these varieties showed good adaptation with good stand. Based on this fact, introducing these varieties for the study areas with medium altitudes will result in best productivity, even though repeating this experiment for another one more year is required.
Abbreviations
GCV: Genotypic Coefficient of Variation
PCV: Phenotypic Coefficient of Variation
H2: Heritability in Broad Sense
Data Availability Statement
Data supporting the findings of this study were included in the manuscript.
Conflicts of Interest
The authors declare no conflicts of interest.
References
[1] Fageria, N. K. and Santos, A. D., 2008. Dry bean yield physiology. Journal of plant nutrition, 31(6), pp. 983-1004.
[2] Negahi, A. Z. A. M., Bihamta, M. R., Negahi, Z. A. H. R. A., and Alidoust, M. O. H. A. M. M. A. D., 2014. Evaluation of the genetic variation of some agronomical and morphological traits in Iranian and exotic common beans (Phaseolus vulgaris L.). Agricultural Communications, 2(3), pp. 22-26.
[3] Eliakira Kisetu Nassary, Patrick Alois, and Ndakidemi 2020. Assessing the Productivity of Common Bean in Intercrop with Maize in Agro-Ecological Zones of Smallholder Farms in the Northern Highlands of Tanzania.
[4] Demelash, B. B. 2018. Common Bean Improvement Status (Phaseolus vulgaris L.) in Ethiopia Models to Analyze Stability of Common Bean (Phaseolus vulgaris L.) Genotypes in Ethiopia. Haricot Bean Production Guide.
[5] Wortmann, C. S., 1998. Atlas of common bean (Phaseolus vulgaris L.) production in Africa (No. 297). CIAT.
[6] Solomon, Y., Tsebaye, T., Melese, E., & Anteneh, B. (2019). Participatory demonstration of the improved variety of Faba beans with its full packages in the Gamo Gofa zone, SNNPRs, Ethiopia. Acta Scientific Agriculture, 4(1), 44–48. Berhanu et al., 2018.
[7] IBPGR, Descriptors of Phaseolus Coccineus, IBPGR, Rome, 1983.
[8] HALLAUER, A. R.&MIRANDA, J. B. (1988), Hamiltonvariancematingdesign. InQuantitativeGenetics inMaize Breeding (Eds. A. R. Hallauer & J. B. Miranda), pp. 45–114. Ames, USA: IowaStateUniversityPress.
[9] Burton, G. M. and DeVane, E. M. 1953. Estimating heritability in tall Fescue from replication clonal material. Agron. J., 45: 478-481.
[10] Johnson, H W, Robinson, H F, & Coinstock, R E., 1955. Estimates of genetic and environmental variability in soybeans. Agronomy Journal, 47: 314-18.
[11] Singh, R. K. and Chaudhury, B. D. 1996. Biometrical Method in Quantitative Genetic Analysis.
[12] Dewey, D. R. and Lu, K. H., 1959. A correlation and path analysis of components of crested wheatgrass seed production. Agronomy Journal, 15: 515-518.
[13] Amare, K. and Kassahun, A., 2021. Participatory selection of varieties for released white common bean varieties in the south Gondar zone, Ethiopia. Heliyon, 7(12). (Emishaw, 2007).
[14] Daniel Tadesse and Tesfaye Wossen 2020. Evaluation of improved varieties of haricot bean in West Belessa, Northwest Ethiopia.
[15] A. Shahid and C. Kamaluddin, 'Correlation and path analysis for agromorphological traits in Rajmash bean under Baramulla-Kashmir', African Journal of Agricultural Research, vol. 8, no. 18, pp. 2027–2032, 2013.
[16] A. Fahad, K. Muhammad, A. Obaid, A. Mukhtar and C. Arshad, “Agromorphological evaluation of some exotic common bean genotypes (Phaseolus vulgaris L.) under rainfed conditions of Islamabad, Pakistan”, Pakistan Journal of Botany, vol. 46, no. 1, pp. 259–264, 2014. Singh, B. D., 1993. Plant Breeding: Principles and Methods Kalyani Publishers. Ludhiana.
[17] Arya PS, Rana Ajay (1999) Study of direct and indirect influences of some yield traits on green pod yield in French bean (Phaseolus vulgaris L.) Adv Horti Forestry 6: 99-106.
[18] Kamaluddin and Shahid Ahmed. 2011. Variability, correlation, and path analysis for yield and yield-related traits in common bean. Indian Journal of Horticulture 68(1): 56–60.
[19] Moges Firew, A. and Mugisha, M., 2017. Genotype by environment interaction on the yield and micronutrient concentration of biofortified common bean (Phaseolus vulgaris L.) in Ethiopia (Doctoral dissertation, Haramaya University).
[20] Ge, T., Sui, F., Bai, L., Tong, C., and Sun, N., 2012. Effects of water stress on growth, biomass partitioning, and water use efficiency in summer maize (Zea mays L.) throughout the growth cycle. Acta Physiologiae Plantarum, 34, pp. 1043-1053.
[21] AlBallat, IAM and Al-Araby, AAM, 2019. Characterization, Genetic Diversity, and Clustering of Common Bean (Phaseolus vulgaris L.) Accessions based on seed yield and related traits. Egyptian Journal of Horticulture, 46(2), pp. 195-213.
[22] Ram, H., Rashid, A., Zhang, W., Duarte, A.., Phattarakul, N., Simunji, S., Kalayci, M., Freitas, R., Rerkasem, B., Bal, R. S. and Mahmood, K., 2016. Biofortification of wheat, rice, and common beans by applying foliar zinc fertilizer in conjunction with pesticides in seven countries. Plant and soil, 403, pp. 389-401.
[23] Kandarkar, K. G., Kute, N. S., Ingle, A. U. and Shinde, G. C., 2020. Genetic divergence studies in Pigeonpea [Cajanus cajan L. Millsp.]. Int J Chem Stud, 8(4), pp. 2067-70.
[24] Prakash, J. and Ram, R. B. (2014). Genetic variability, correlation, and path analysis for seed yield and yield related traits in French bean (Phaseolus vulgaris L.) under Lucknow conditions. Int. J. Innovative Sci., Eng. & Tech. 6 (1): 41-50.
[25] Gebre-Egziabher Murut, Hadush Tsehaye, and Fetien Abay 2014. Agronomic performance of some varieties of haricot beans (Phaseolus vulgaris L.) with and without phosphorus fertilizer under irrigated and rain-fed conditions in the Tigray and Afar regions, northern Ethiopia.
[26] Dembele Ersulo, Ashenafi Dana. (2018). Evaluation of common bean varieties for yield and yield component in the Segen area peoples zone SNNPRS, Ethiopia. Food Science and Quality Management. ISSN 2224-6088 (Paper) ISSN 2225-0557 (Online). Vol. 72, 2018.
[27] Subramanian S, Subramanian M. Correlation studies and path coefficient analysis in sesame (Sesamum indicum). J. Agron. Crop Science. 1994, 173: 241-248.
[28] Wani, A. B., Bhat, M. A., and Mir, S., 2015. MORPHOLIGICAL CHARACTERIZATION AS INDICES FOR THE SELECTION OF YIELD AND YIELD COMPONENTS IN COMMON BEAN (Phaseolus vulgaris L.) IN J&K. Journal of Global Biosciences, 4(9), pp. 3391-3394.
[29] Wondwosen Wondimu and Abebe Bogale, 2017. Genetic Variability, Heritability, and Genetic Advance of Some Haricot Bean (Phaseolus vulgaris L.) Varieties in the Bench-Maji Zone, southwest Ethiopia.
[30] Raffi, SA and Nath, UK, 2004. Variability, heritability, genetic advance, and relationships of yield and yield contributing characters in dry bean (Phaseolus vulgaris L.). J. Biol. Sci., 4(2), pp. 157-159. Esho, (2018).
[31] ESHO, K. B., 2018, October. Study the genetic parameters in phaseolus. In Proceedings of Academicsera 32nd International Conference (Vol. 25, p. 26th).
[32] Alghamdi, S. S., 2007. Genetic behavior of some selected genotypes of Faba beans. Proceedings of the African Crop Science Conference, printed in ElMinia, Egypt, 8: 709-714.
[33] Gonçalves, JGR, Andrade, ERD, Silva, DAD, Esteves, JADF, Chiorato, AFM, and Carbonell, SAM, 2019. Drought tolerance evaluated in common bean genotypes. Ciência e Agrotecnologia, 43.
[34] Panchbhaiya, A., Singh, D. K., Verma, P., Jatav, V. and Maurya, A. K., 2017. Genetic analysis of French bean (Phaseolus vulgaris l.) germplasm through principal component analysis and D2 cluster analysis. Journal of Pharmacognosy and Phytochemistry, 6(3), pp. 537-542.
[35] Ejigu Ejara, W. M., AMSALU, B., MISGANA, Z., GABISA, M. and TASAMA, G., 2017. REGULAR ARTICLE PERFORMANCE EVALUATION OF GRAIN YIELD AND YIELD RELATED TRAITS IN COMMON BEAN GENOTYPES AT YABELLO AND ABAYA, SOUTHERN ETHIOPIA. Journal of Aridland Agriculture, 3, pp. 28-34.
[36] Falconer, D. S., and T. F. C. Mackay, 1996. An Introduction to Quantitative Genetics 4 the dn., Prentice Hall, London.
[37] López CE, Acosta IF, Jara C, Pedraza F, Gaitán-Sols E, Gallego G, Beebe S, Tohme J (2003) Identifying resistance gene analogs associated with resistances to different pathogens in common bean. Phytopathology 93: 88–95.
[38] Kulaz, H. and Ciftci, V., 2012. Relationships among the yield components and selection criteria for improving the seed yield in the bush bean (Phaseolus vulgaris L.). Journal of Agricultural Sciences, 18(4), pp. 257-262.
[39] Ambachew, D., Mekbib, F., Asfaw, A., Beebe, SE, and Blair, MW 2015. Trait associations in common bean accessions grown under drought stress and field infestation by BSM bean fly. The Crop Journal, 3 (4): 305-316.
[40] Akhshi, N., Nazarian Firouzabadi, F., Cheghamirza, K., and Dorri, HR, 2015. Coefficient analysis and association between morphoagronomical characters in common bean (Phaseolus vulgaris L.).
[41] Aisha Sodagar, Muhammad Ahsan Iqbal, Sadar Uddin Siddiqui, Qasim Farooq, Muhammad Shakir, Ahsan Rasheed, Asha Mushtaq, 2020. Correlation coefficient and path coefficient analysis for yield and its component traits in common bean (Phaseolus vulgaris L.) germplasm.
[42] Ibrahim Alsawy Al-Ballat and Asem Abd Al-Mageid Al-Arab 2019. Characterization, Genetic Diversity, and Clustering of Common Bean (Phaseolus vulgaris L.) Accessions Based on Seed Yield and Related Traits.
Cite This Article
  • APA Style

    Demessie, F., Gebresilassie, W., Garedew, W., Shifaraw, G. (2024). Evaluation of Common Bean (Phaseolus vulgaris L) Cultivars for Yield and Yield-Related Traits at Sekoru District, South Western Ethiopia . American Journal of Applied Scientific Research, 10(1), 1-16. https://doi.org/10.11648/j.ajasr.20241001.11

    Copy | Download

    ACS Style

    Demessie, F.; Gebresilassie, W.; Garedew, W.; Shifaraw, G. Evaluation of Common Bean (Phaseolus vulgaris L) Cultivars for Yield and Yield-Related Traits at Sekoru District, South Western Ethiopia . Am. J. Appl. Sci. Res. 2024, 10(1), 1-16. doi: 10.11648/j.ajasr.20241001.11

    Copy | Download

    AMA Style

    Demessie F, Gebresilassie W, Garedew W, Shifaraw G. Evaluation of Common Bean (Phaseolus vulgaris L) Cultivars for Yield and Yield-Related Traits at Sekoru District, South Western Ethiopia . Am J Appl Sci Res. 2024;10(1):1-16. doi: 10.11648/j.ajasr.20241001.11

    Copy | Download

  • @article{10.11648/j.ajasr.20241001.11,
      author = {Feleke Demessie and Wosene Gebresilassie and Weyessa Garedew and Garome Shifaraw},
      title = {Evaluation of Common Bean (Phaseolus vulgaris L) Cultivars for Yield and Yield-Related Traits at Sekoru District, South Western Ethiopia
    },
      journal = {American Journal of Applied Scientific Research},
      volume = {10},
      number = {1},
      pages = {1-16},
      doi = {10.11648/j.ajasr.20241001.11},
      url = {https://doi.org/10.11648/j.ajasr.20241001.11},
      eprint = {https://article.sciencepublishinggroup.com/pdf/10.11648.j.ajasr.20241001.11},
      abstract = {The low productivity of common beans is attached to many yield constraints such as lack of improved varieties; poor management practices, biotic and abiotic factors. This study was conducted to evaluate the performance of improved common bean varieties for yield and yield related traits in the Sekoru district of the Jimma zone and identify high-yielding varieties for the study area. Eleven released and one local common bean variety were tested in two locations (Yero Sekoru and Inkure), using a randomized complete block design with three replications. Data were collected for 12 quantitative traits and subjected to analysis using SAS software. The interaction effect of genotype by location showed a highly significant variation for all traits except for plant height, dry biomass yield, and hundred seed weight. The phenotypic coefficient of variation was higher than the genotypic coefficient of variation for all traits. Higher The phenotypic coefficient of variation was recorded for 100 seed weight (52.78), pod length (28.9), pods per plant (27.63), harvest index (25.94) and seed yield (24.6) and also a high genotypic coefficient of variance (GCV) was observed for 100 seed weight (20.24) and pods per plant (20.34). Low (20) and high (93.5) heritability in broad sense were recorded in days to 50% flowering and dry biomass yield, respectively. At the phenotypic level, all traits had a positive phenotypic significant correlation with seed yield per hectare except for primary branches per plant day to 95% physiological maturity and hundred seed weight, while a negative significant correlation with seed yield per hectare was observed for days to 50% flowering. Genotypic path coefficient analysis indicates that the traits studied showed a positive direct effect on seed yield per hectare, while plant height, primary branches and secondary branches per plant, days to 50% flowering, days to 95% physiological maturity and 100 seed weight exhibited a negative direct effect. However, a positive direct phenotypic effect was observed for traits such as dry biomass yield, pod length, primary branches per plant, seeds per pod, and days to 95% physiological maturity. Among the varieties tested in both locations, the highest yield was recorded for the Ser119 variety (2865.2 kg/ha) followed by the Ser125 variety (2699.2 kg/ha). Therefore, recommending these varieties to farmers in the study area is very important to increase production and income.
    },
     year = {2024}
    }
    

    Copy | Download

  • TY  - JOUR
    T1  - Evaluation of Common Bean (Phaseolus vulgaris L) Cultivars for Yield and Yield-Related Traits at Sekoru District, South Western Ethiopia
    
    AU  - Feleke Demessie
    AU  - Wosene Gebresilassie
    AU  - Weyessa Garedew
    AU  - Garome Shifaraw
    Y1  - 2024/04/02
    PY  - 2024
    N1  - https://doi.org/10.11648/j.ajasr.20241001.11
    DO  - 10.11648/j.ajasr.20241001.11
    T2  - American Journal of Applied Scientific Research
    JF  - American Journal of Applied Scientific Research
    JO  - American Journal of Applied Scientific Research
    SP  - 1
    EP  - 16
    PB  - Science Publishing Group
    SN  - 2471-9730
    UR  - https://doi.org/10.11648/j.ajasr.20241001.11
    AB  - The low productivity of common beans is attached to many yield constraints such as lack of improved varieties; poor management practices, biotic and abiotic factors. This study was conducted to evaluate the performance of improved common bean varieties for yield and yield related traits in the Sekoru district of the Jimma zone and identify high-yielding varieties for the study area. Eleven released and one local common bean variety were tested in two locations (Yero Sekoru and Inkure), using a randomized complete block design with three replications. Data were collected for 12 quantitative traits and subjected to analysis using SAS software. The interaction effect of genotype by location showed a highly significant variation for all traits except for plant height, dry biomass yield, and hundred seed weight. The phenotypic coefficient of variation was higher than the genotypic coefficient of variation for all traits. Higher The phenotypic coefficient of variation was recorded for 100 seed weight (52.78), pod length (28.9), pods per plant (27.63), harvest index (25.94) and seed yield (24.6) and also a high genotypic coefficient of variance (GCV) was observed for 100 seed weight (20.24) and pods per plant (20.34). Low (20) and high (93.5) heritability in broad sense were recorded in days to 50% flowering and dry biomass yield, respectively. At the phenotypic level, all traits had a positive phenotypic significant correlation with seed yield per hectare except for primary branches per plant day to 95% physiological maturity and hundred seed weight, while a negative significant correlation with seed yield per hectare was observed for days to 50% flowering. Genotypic path coefficient analysis indicates that the traits studied showed a positive direct effect on seed yield per hectare, while plant height, primary branches and secondary branches per plant, days to 50% flowering, days to 95% physiological maturity and 100 seed weight exhibited a negative direct effect. However, a positive direct phenotypic effect was observed for traits such as dry biomass yield, pod length, primary branches per plant, seeds per pod, and days to 95% physiological maturity. Among the varieties tested in both locations, the highest yield was recorded for the Ser119 variety (2865.2 kg/ha) followed by the Ser125 variety (2699.2 kg/ha). Therefore, recommending these varieties to farmers in the study area is very important to increase production and income.
    
    VL  - 10
    IS  - 1
    ER  - 

    Copy | Download

Author Information
  • Jimma District Agricultural Office, Sekoru Woreda Irrigation Agronomist, Jimma, Ethiopia

  • Department Horticulture and Plant Science, College of Agriculture and Veterinary Medicine, Jimma University, Jimma, Ethiopia

  • Department Horticulture and Plant Science, College of Agriculture and Veterinary Medicine, Jimma University, Jimma, Ethiopia

  • Department of Plant Science, Mattu University, Bedele Campus, Bedele, Ethiopia

  • Abstract
  • Keywords
  • Document Sections

    1. 1. Introduction
    2. 2. Materials and Methods
    3. 3. Results and Discussion
    4. 4. Conclusion and Recommendation
    Show Full Outline
  • Abbreviations
  • Data Availability Statement
  • Conflicts of Interest
  • References
  • Cite This Article
  • Author Information